

Microsoft Sentinel graph is here to help you visualize complex relationships

We recently blogged about Microsoft’s many graphs. But we left out one very important one — the new Microsoft Sentinel graph.
Sentinel graph is a security-focused analytics and visualization capability within the Microsoft Sentinel platform. It enables defenders and AI agents to reason over interconnected assets, identities, activities, and threat intelligence. The public preview powers new graph-based experiences in Microsoft Defender and Purview, such as blast radius analysis, incident investigation, and data risk assessment.
It offers interconnected security graphs to help at every stage of defense.
Key Features:
Blast radius analysis in Defender incident graphs helps you evaluate and visualize the vulnerable paths an attacker could take from a compromise entity to a critical asset
Blast Radius example Graph-based hunting for privileged access paths helps you visually navigate the complex web of relationships between users, devices, and other entities to show privileged access paths to critical assets to prioritize incidents and response effort
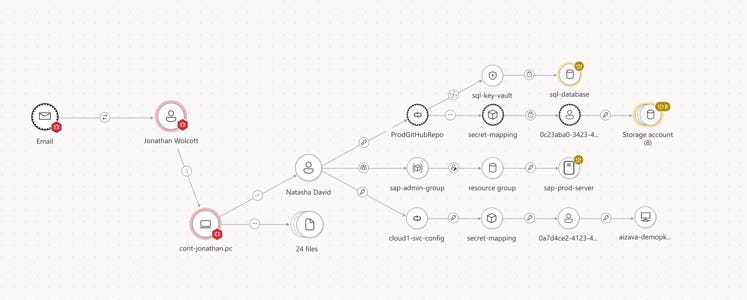
Microsoft Purview Data Security Investigations graphs point you to sensitive data access and movement, map potential exfiltration paths, and visualize the users and activities linked to risky files, all in one view
Activity analysis via Microsoft Purview Insider Risk Management supports user risk assessment and helps you identify the data leak blast radius of risky user activity across SharePoint and OneDrive

Who Should Use It:
Security teams looking for deep, relationship-driven insights into threats and vulnerabilities.