

Visual threat paths with the Hunting graph in Sentinel

Traditional hunting in Microsoft Sentinel relies on KQL joins and pivot tables. KQL is a powerful tool, but it requires skill and practice. It can also be difficult to use when you’re chasing relationships across users, devices, and resources. Attackers don’t move in straight lines; they weave through identity chains, shared access, and lateral movement paths. The new hunting graph Sentinel helps alleviate these challenges and changes the game by turning those invisible threads into an interactive map.
Instead of scanning rows of logs, the hunting graph allows analysts to see relationships as nodes and edges. They can trace potential attack paths and uncover choke points that tabular queries might miss.
Try it out
Start with a hypothesis. For example, “Could this compromised account pivot into sensitive groups?” It would be easy to see what groups this account is a member of. But you can go deeper with the graph. You can explore relationships and connect the dots in a way that a linear query just can’t do.
Go into Advanced Hunting, select Hunting graph. Then choose the predefined scenario “Paths between two entities”.
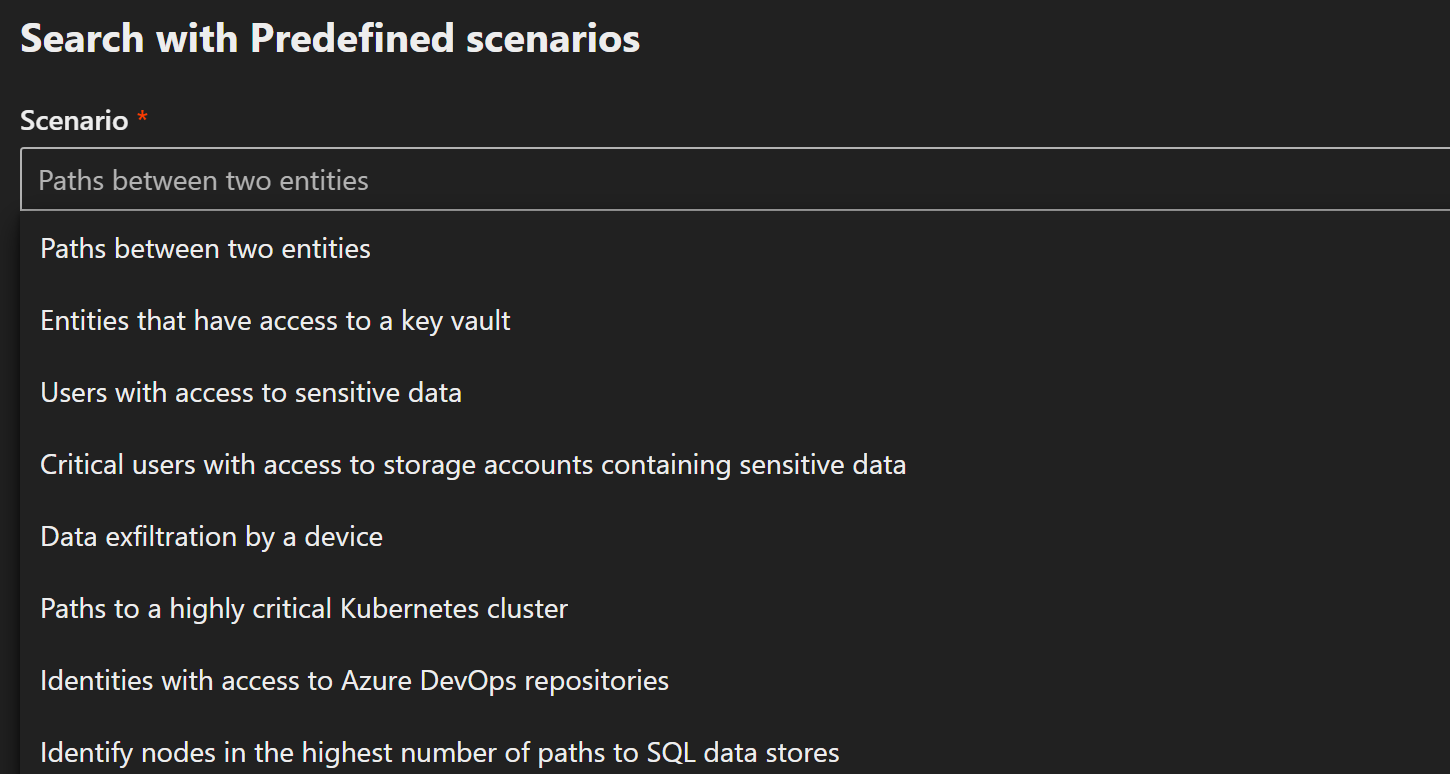
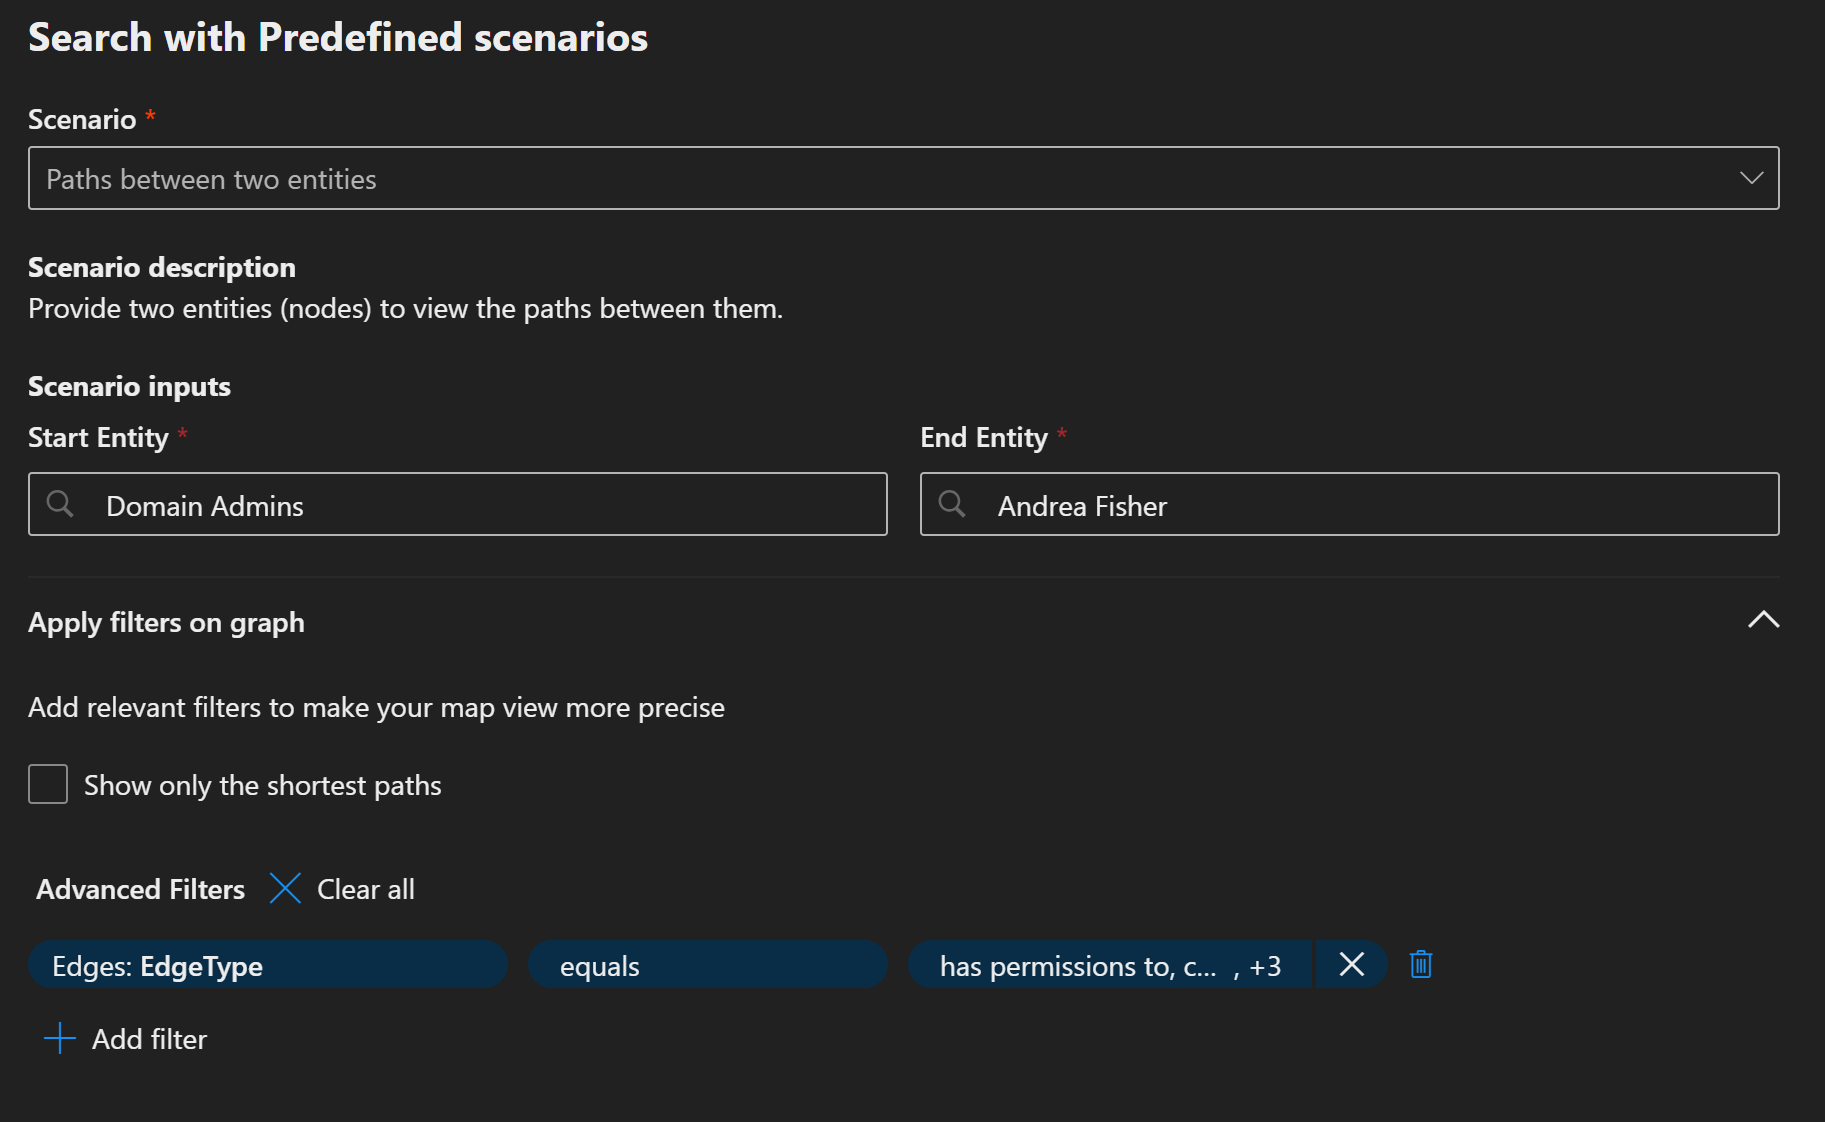
Fill out your “Start Entity” and your “End Entity”.
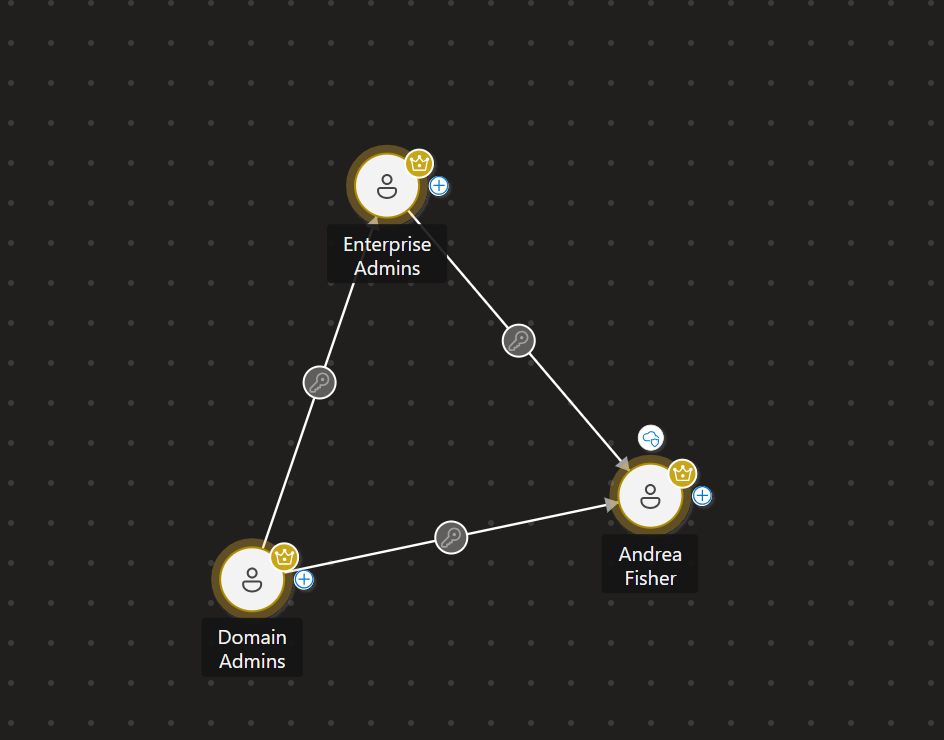
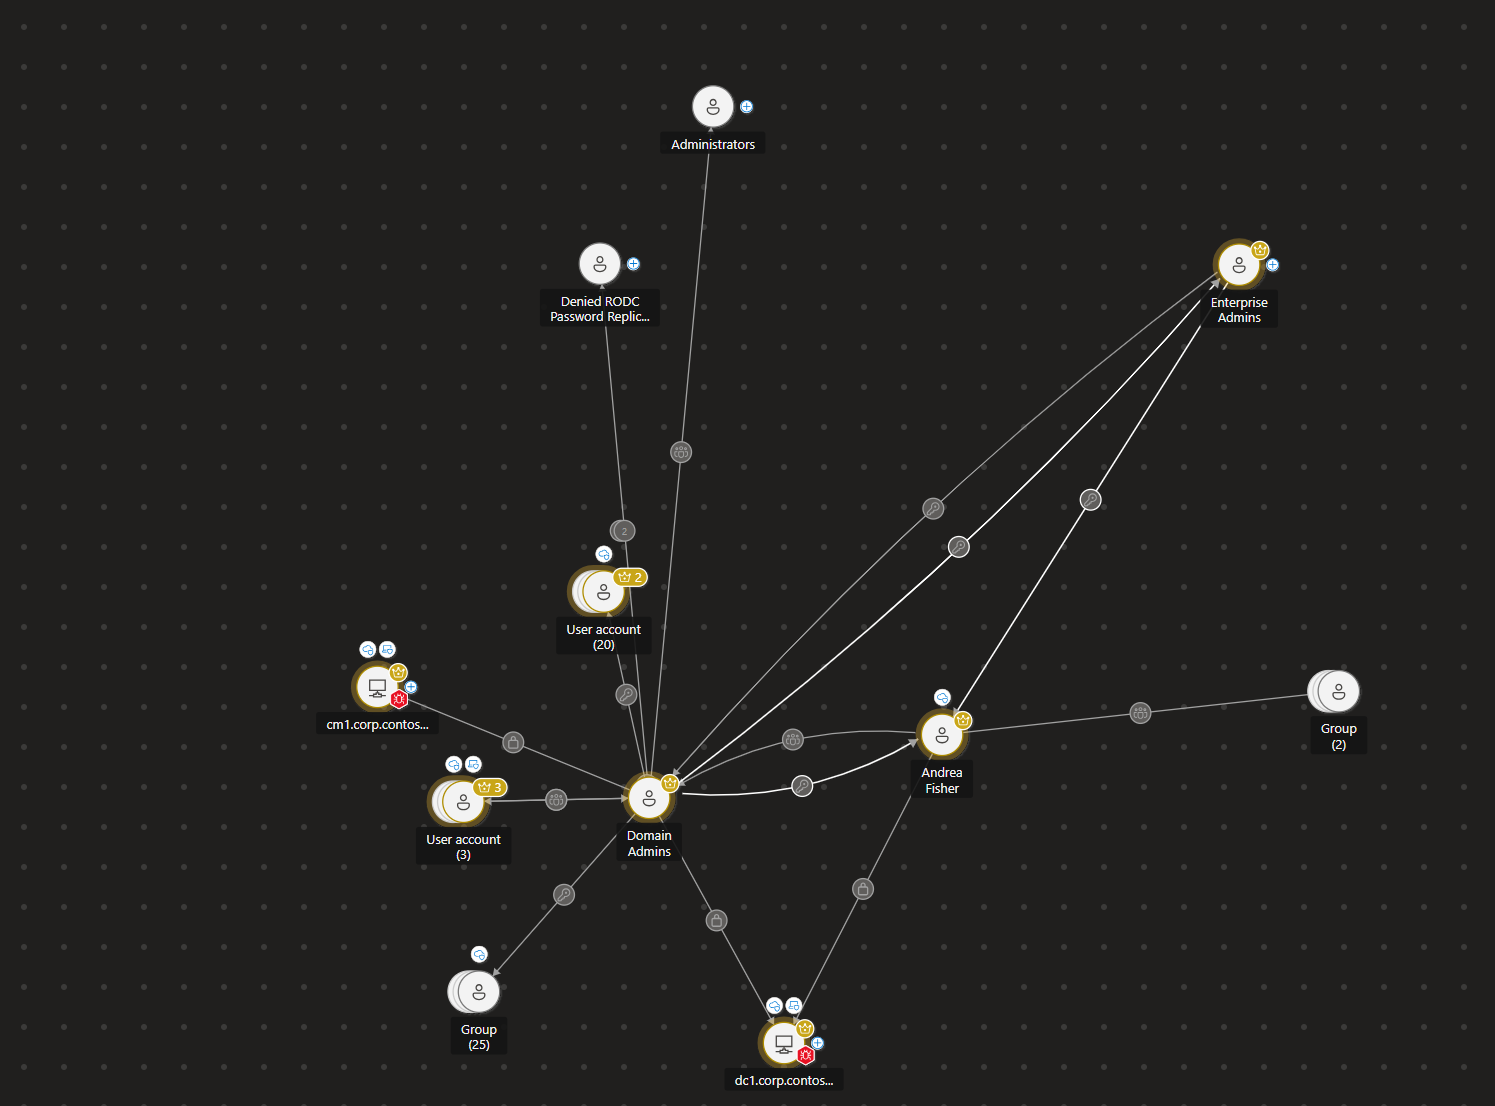
The initial graph shows a set of connections. The crown icon indicates the resource is considered a high-value asset. You can hover on the key to see that it indicates that “has a role on” - meaning that the Andrea Fisher account is a member of both Enterprise Admins and Domain Admins.
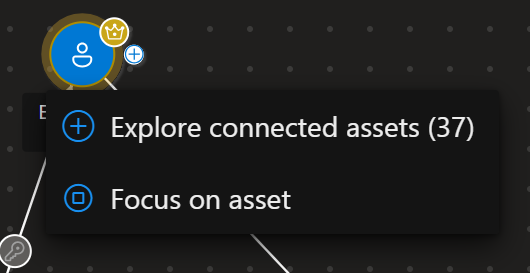
I can right click on the assets to “Explore connected assets”. You can see that Enterprise Admins has 37 connected assets.
The graph grows as you explore…
One relationship that might surprise us is that the account has access to the CM1 server which is the Configuration Management server that does all the patching. This could mean that if the account were compromised, an attacker could stop the servers from updating. I might have figured that out eventually but with the graph it’s easy to spot these kinds of issues.
What to know
Hunting graph isn’t just a feature—it’s a mindset shift. From rows to relationships, from reactive to proactive. If you’re serious about reducing dwell time and exposing lateral movement before it happens, this could be your new best friend.